 載入中...請稍候...
產品介紹
Hardware Feature
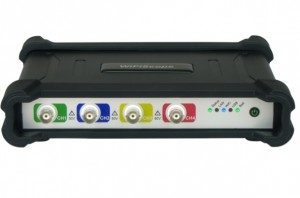
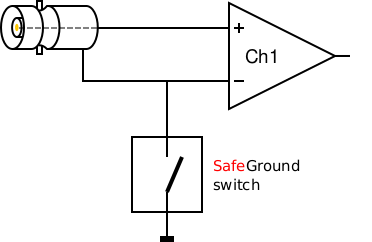
This powerful high speed WiFi oscilloscope combines fast sampling up to 1 GSa/s with high resolutions of 12, 14 and 16 bit and a large memory of 64 MSamples on all four channels. The oscilloscope supports continuous streaming measurements up to 200 MSa/s and can be synchronized with other oscilloscopes using the CMI interface to form a multi channel combined instrument with synchronized time base. The CMI interface is available by default on the WiFiScope WS6 DIFF. Optionally, the WiFiScope WS6 DIFF can be delivered with SureConnect connection test and resistance measurement on each channel. Also, the WiFiScope WS6 DIFF can be delivered with SafeGround option. With SafeGround you can switch the differential inputs of the WiFiScope WS6 DIFF into single ended inputs with ground protection. It allows to make measurements using standard attenuating probes and protects the scope when a short circuit to ground is created.
The flexibility and quality that the WiFiScope WS6 DIFF offers is unparalleled by any other oscilloscope in its class.
Rugged industrial design
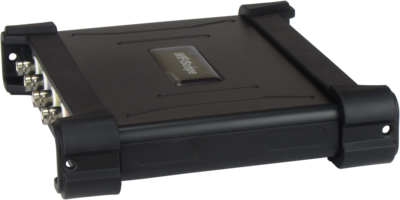
The WiFiScope WS6 DIFF features a rugged design. Its enclosure is fitted with rubber protectors at the front and the rear. These protect the WiFiScope WS6 DIFF against damage by mechanical shocks. The rubber helps absorbing shocks and protects the connectors at the front and the rear of the WiFiScope WS6 DIFF, these fall within the protected zone.
Additionally, the rubber prevents your WiFiScope WS6 DIFF from sliding. The rubber protectors have special notches that simplify stacking instruments. Holes are included that allow to connect a strap to hang the instrument near the test subject.
SafeGround
SafeGround gives the possibility to use the oscilloscope inputs both as single ended and as differential. When SafeGround is active and you accidentally create a wrong connection that causes a short circuit, SafeGround will disconnect the ground of the input channel without damaging the oscilloscope or PC.
SureConnect
The SureConnect connection test feature of the WiFiScope WS6 DIFF tells you immediately whether your test probe or clip actually makes electrical contact or not. No more doubt whether your probe doesn't make contact or there really is no signal.

EMI pre compliance testing
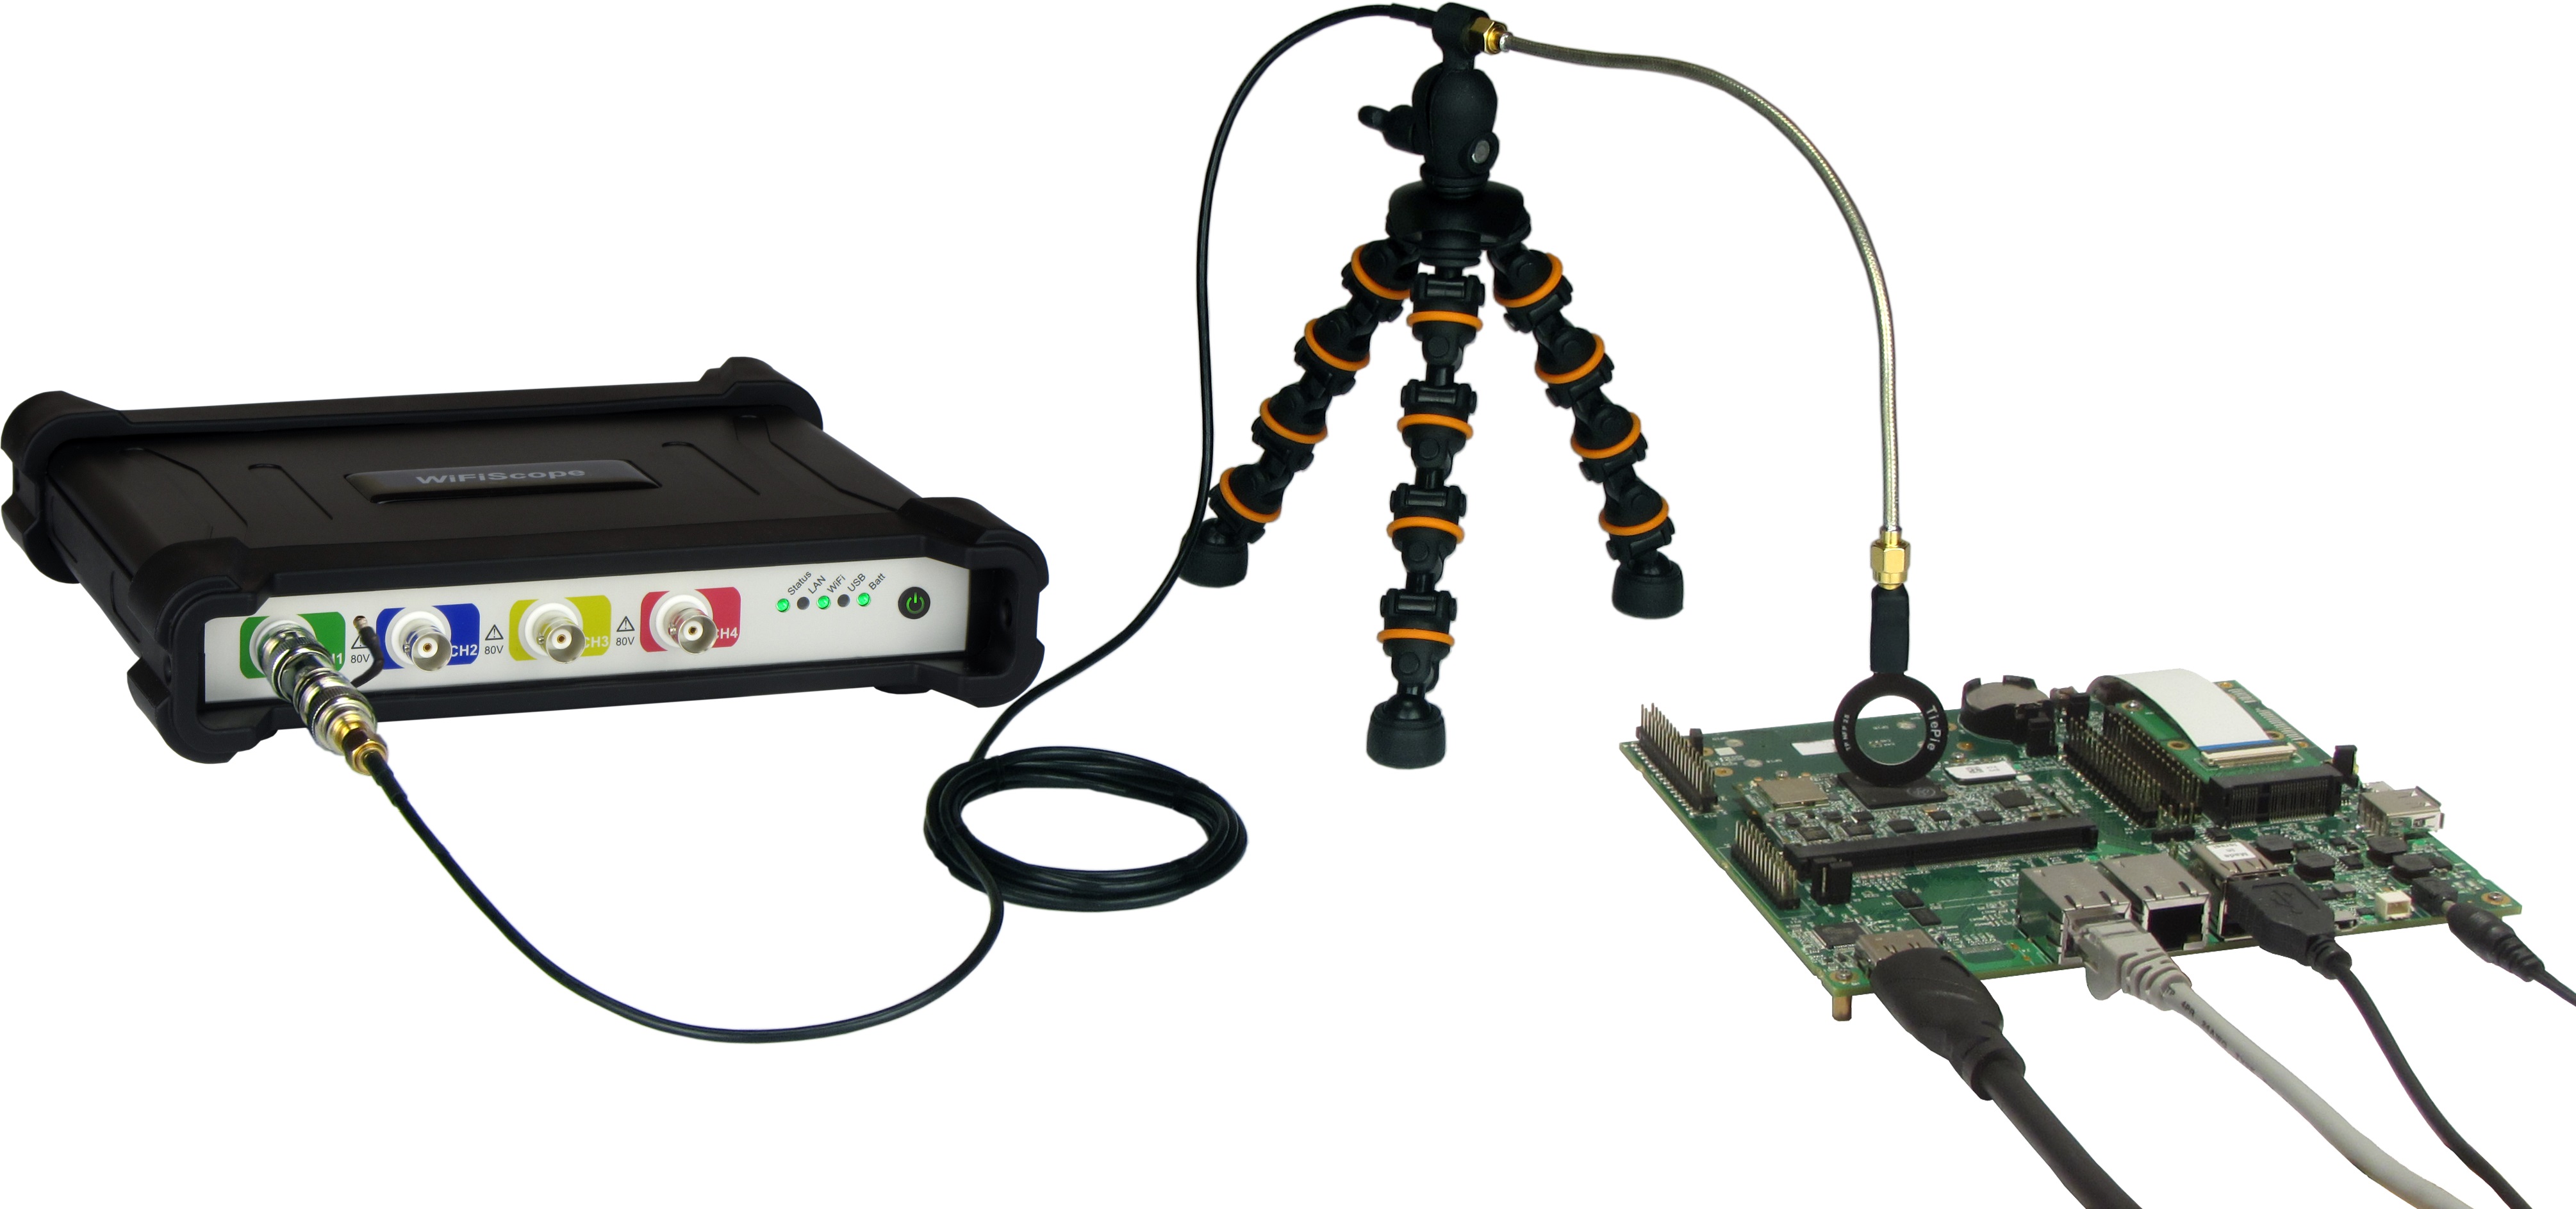
The powerful capabilities of the WiFiScope WS6 DIFF - 1000XMESG EMI analyzer give the user the possibility to quickly perform a good EMI compliance test. With this cost effective test, time and money are saved by avoiding extra visits to expensive EMC testing facilities. The supplied EMI probe set TP-EMI-HS6 contains three magnetic field (H field) probes and one electric field (E field) probe. The tripod ensures that the probes can be positioned properly at the object under test.
Read more about the EMI option
Multi instrument synchronisation
The WiFiScope WS6 DIFF is equipped with a sophisticated CMI synchronization bus, allowing to connect multiple WiFiScope WS6 DIFFs to each other by means of TP-C50H Coupling cable CMIs, to use them as a combined and synchronized instrument. All instruments will measure at the same sample frequency (0 ppm deviation!). Apart from a synchronization bus, the CMI also contains a trigger bus and a detection bus. The maximum number of instruments is only limited by the number available USB ports.
Read more about multi instrument synchronisation View the CMI interface video
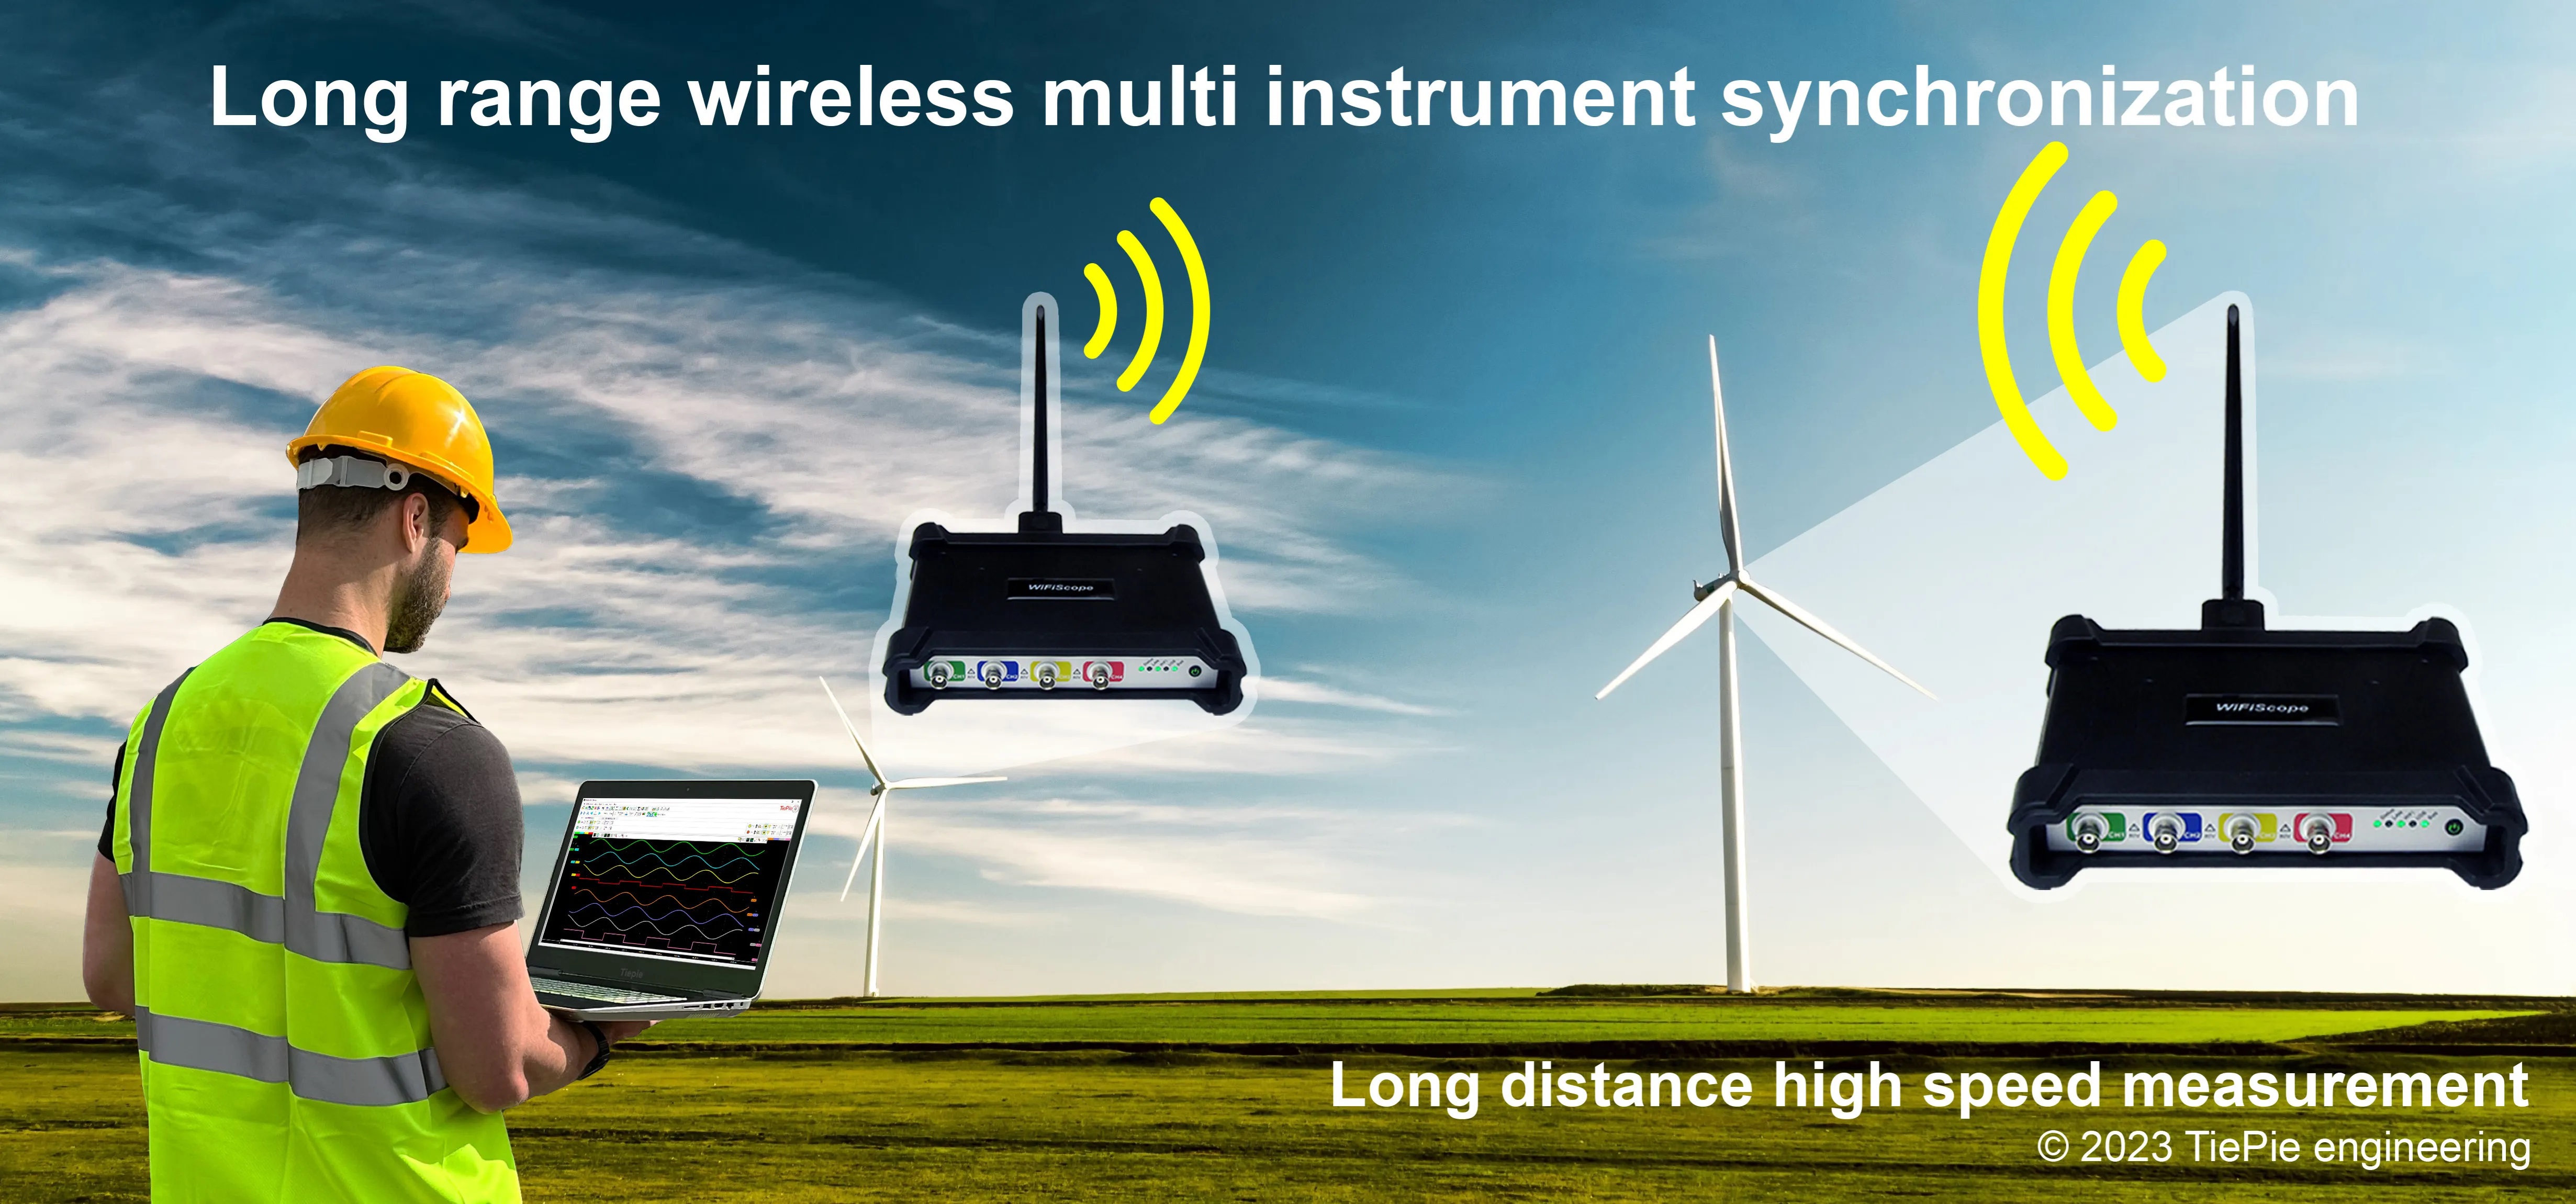
When the instruments are located further apart, yet have to be combined and synchronized, the Wireless Multi Instrument Synchronization Module WCMI can be used. The WCMI modules are connected to the extension port of the instruments and allow to synchronize instruments that are up to 400 m apart.
High accuracy
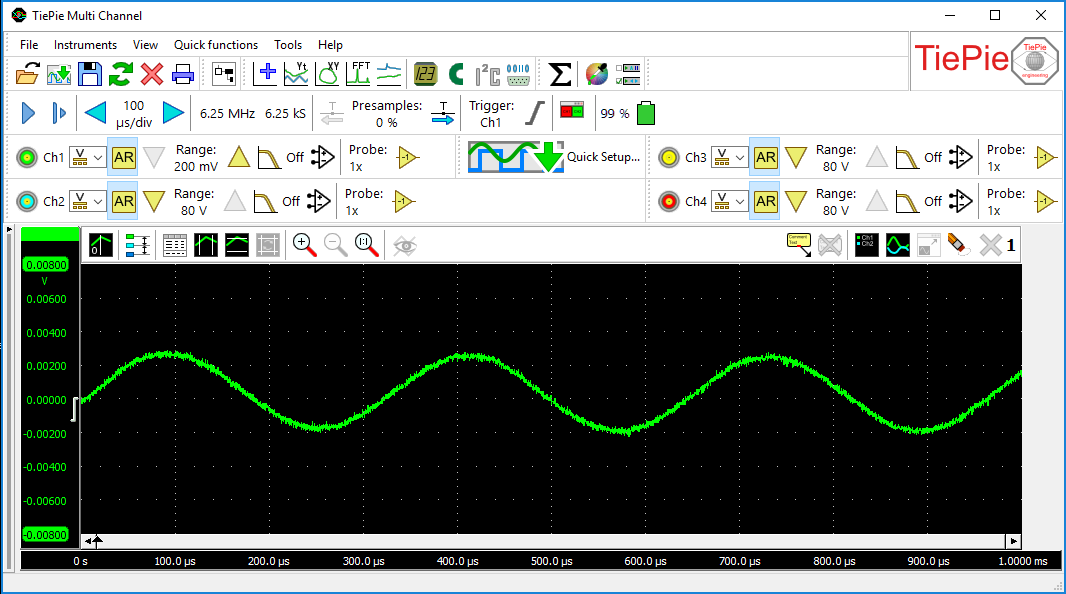
The WiFiScope WS6 DIFF measures with high resolutions of 14 and 16 bit. A signal measured with the WiFiScope WS6 DIFF therefore has 256 times more resolution than most standalone oscilloscopes, which usually have a low resolution of 8 or 9 bit. The high resolution of the WiFiScope WS6 DIFF precision oscilloscope allows for measuring signals with more accuracy, because the quantization error is much lower.
Large memory
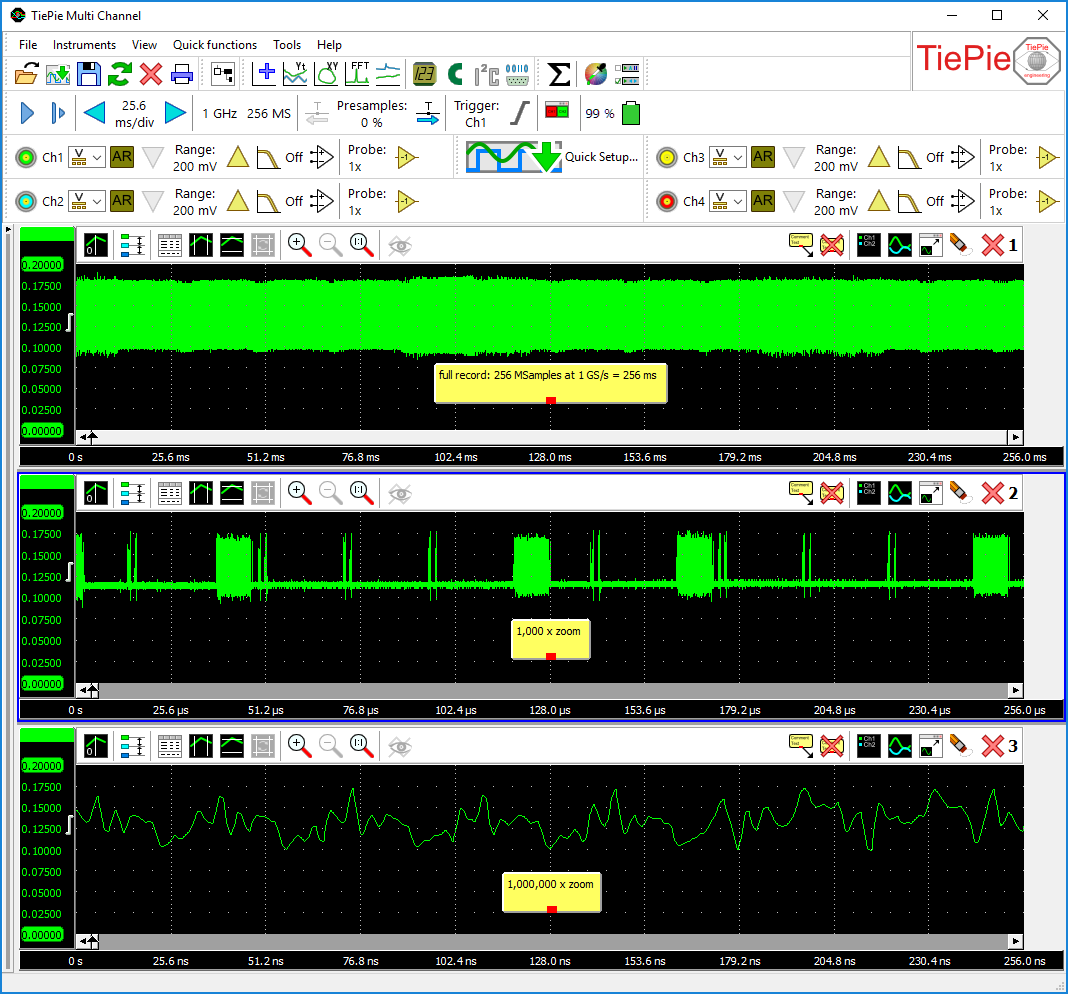
When measuring at high sample rates, a long record length/large memory is necessary to be able to record a complete signal in the acquisition buffer. Where most oscilloscopes have 2.5 kSamples or 100 kSamples memory, the WiFiScope WS6 DIFF has up to 256 MSamples memory per channel, depending on the selected resolution and the number of active channels. When measuring at 14 bit resolution and all four channels, the available memory is 32 MSamples per channel. This gives the user 300 to 100000 times more memory. An advantage of a large memory is that once-only fast phenomena can be captured accurately or complete serial communication signal blocks can be measured all at once. For example complete serial communications, like CAN bus signals, can be measured all in one record to be reviewed and analyzed afterwards.
Bandwidth limit
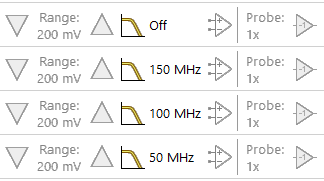
It seems reasonable to assume that more bandwidth is better, but a wider bandwidth gives more noise. To reduce your noise you can switch on a bandwidth limiter for each channel of the WiFiScope WS6 DIFF.
Versatile Multi Channel oscilloscope software
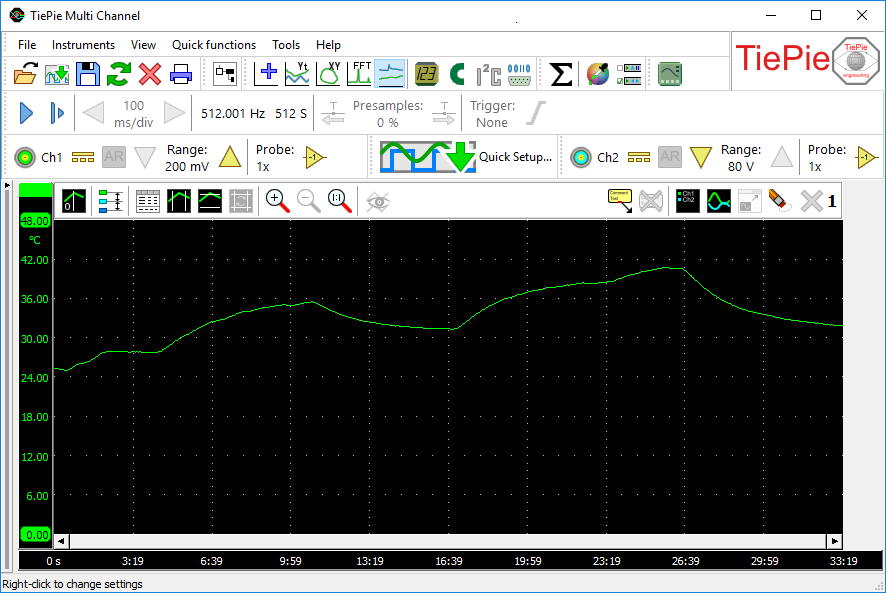
The WiFiScope WS6 DIFF is delivered with the versatile Multi Channel oscilloscope software, which transforms the WiFiScope WS6 DIFF into an oscilloscope, spectrum analyzer, data logger, multimeter and protocol analyzer.
Some of the powerful features of the Multi Channel oscilloscope software are indicated below, for a full description of the Multi Channel oscilloscope software, refer to the Multi Channel oscilloscope software pages.
Quick Setup
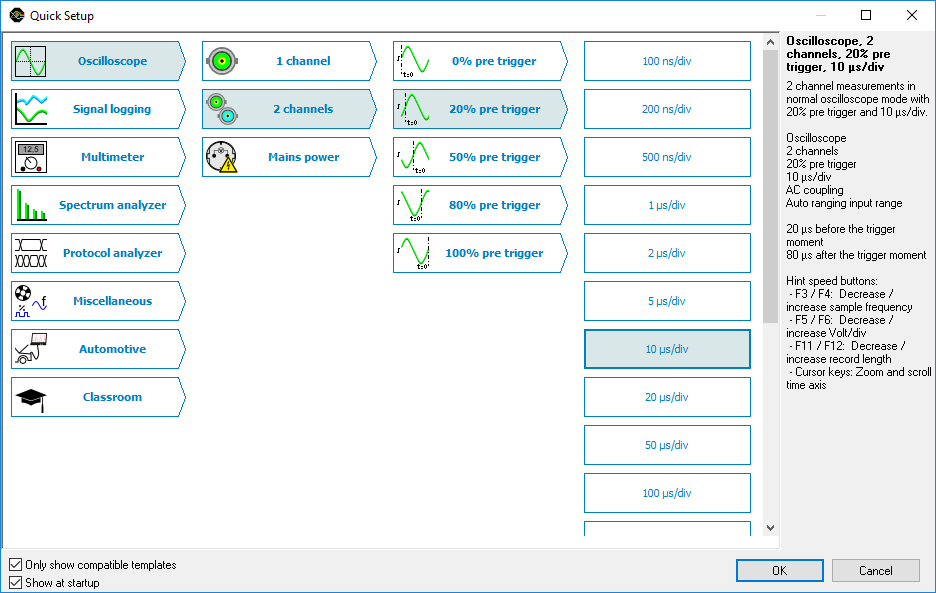
To simplify setting up the measurements, the Multi Channel oscilloscope software contains a large number of Quick Setups, for almost any application. A Quick Setup contains the basic settings for a specific measurement as well as additional information regarding the selected Quick Setup, like e.g. how your Handyscope and/or accessories need to be connected. Quick Setups can also contain reference signals. After loading the Quick Setup, that specific measurement can be performed and if needed, small adjustments to the setup can be made.
The Quick Setups are carefully organized in a tree structure, ordered by application. Just a few mouse clicks allow to perform a complex measurement.
Flexible signal displays
The Multi Channel oscilloscope software scope, spectrum analyzer and datalogger offer an ultimately flexible way to display all aspects of the measured signals. They can have one or more graphs, each displaying one or more signals, where each graph can display different parts of a signal. Graphs can display the signal(s) of your Handyscope in Yt mode, in XY mode or as frequency spectrum, with or without interpolation. Colors of all items in a graph can be set to any required value. Graph dimensions can be adjusted to any required size, graphs can be located in one single window or in separate windows, which can be located anywhere on the desktop.
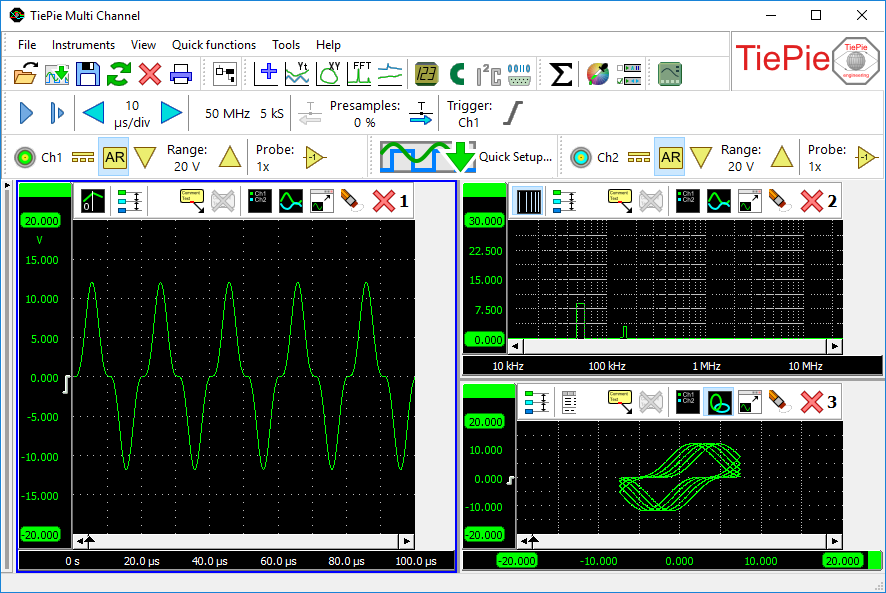
Many automatic measurements
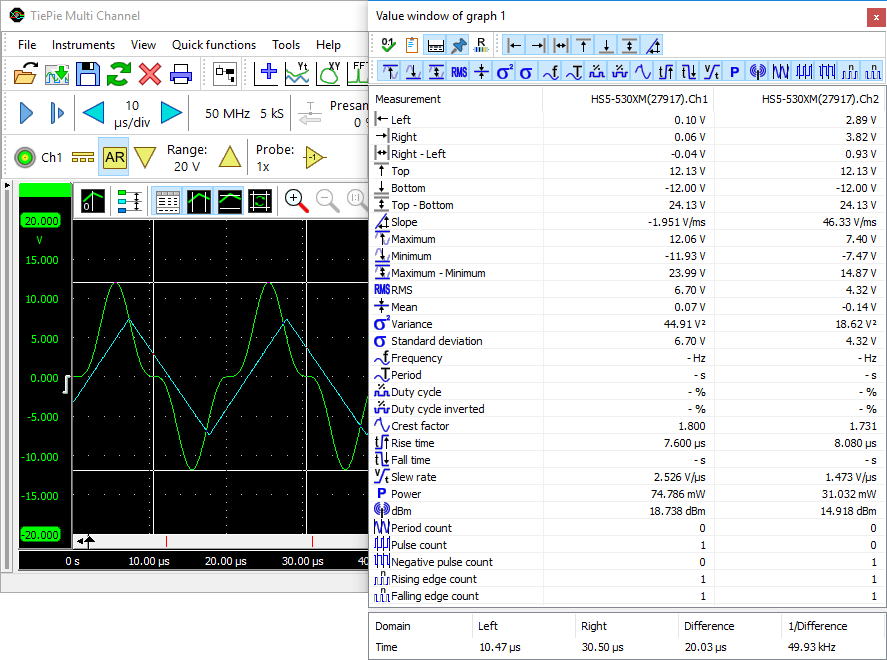
The Multi Channel oscilloscope software features many automatic measurements, that can be performed on the measured signals of your Handyscope or on a selection of the measured signals. Using the automatic measurements in the oscilloscope, any detail of your signal is revealed. Two sets of cursors, both horizontal and vertical, can be used to indicate a part of the signal that needs to be examined thoroughly. The automatic measurements include e.g.: Mininum, Maximum, Top-Bottom, RMS, Mean, Variance, Standard deviation, Frequency.
The measurement results are shown in a special value window that can be positioned anywhere on your computer screen. A convenient toolbar allows you to enable or disable a measurement with a single click. The measurement results can be copied to the clipboard e.g. to use them in reports. When printing the graphs, the cursors and measurements results are also included.
High detail spectrum analyzer
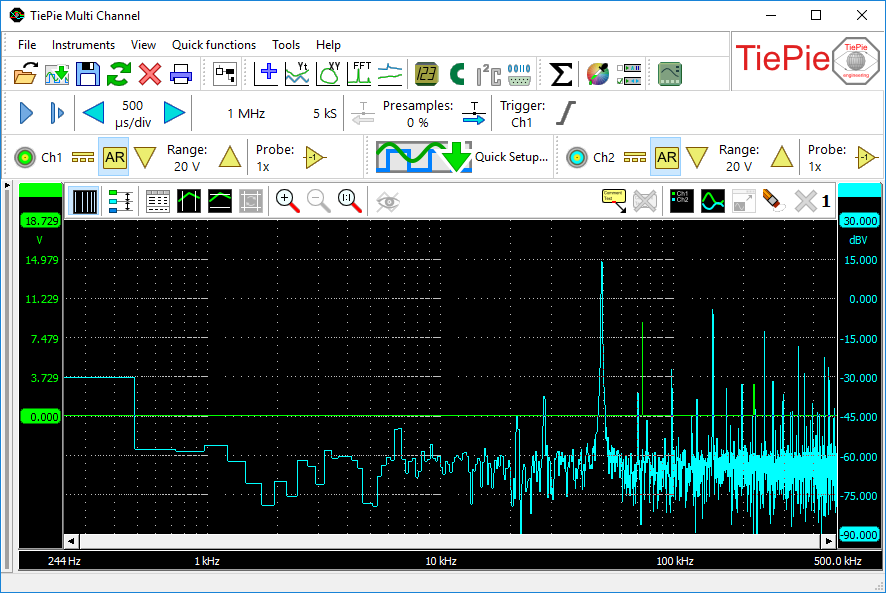
The high detail Multi Channel oscilloscope software spectrum analyzer takes full benefit of the deep memory of the high resolution USB Handyscopes. Not only gives the deep memory an incredible low resolution bandwidth of just 7.45 Hz at a frequency span of 500 MHz, it also gives a vertical dynamic range of 140 dB. The fast and powerful FFT routines with many user selectable window functions allow you to see the smallest frequency components in your signals.
The multi display option of the Multi Channel oscilloscope software spectrum analyzer allows viewing multiple parts of the spectrum at the same time, giving a better understanding of the signals that are analyzed.
Advanced triggers
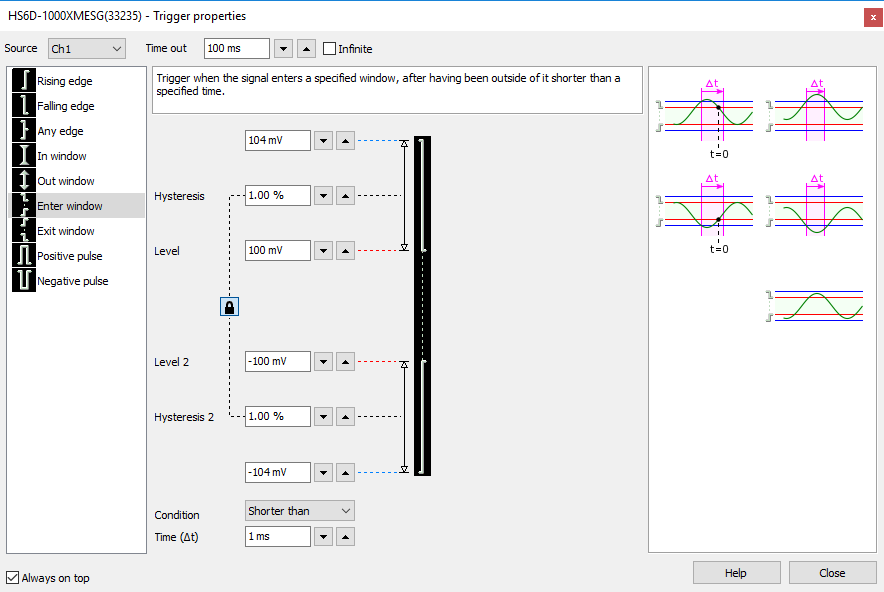
To control the advanced trigger capabilities of your Handyscope, the Multi Channel oscilloscope software provides for a convenient trigger properties dialog. It allows to view and set all properties of the trigger, like e.g. trigger source, trigger type, all levels and hystereses and optional time conditions. Additionally, it gives an explanation on the selected trigger type and examples that do cause a trigger (left column) and do not cause a trigger (right column).
Unlimited zoom
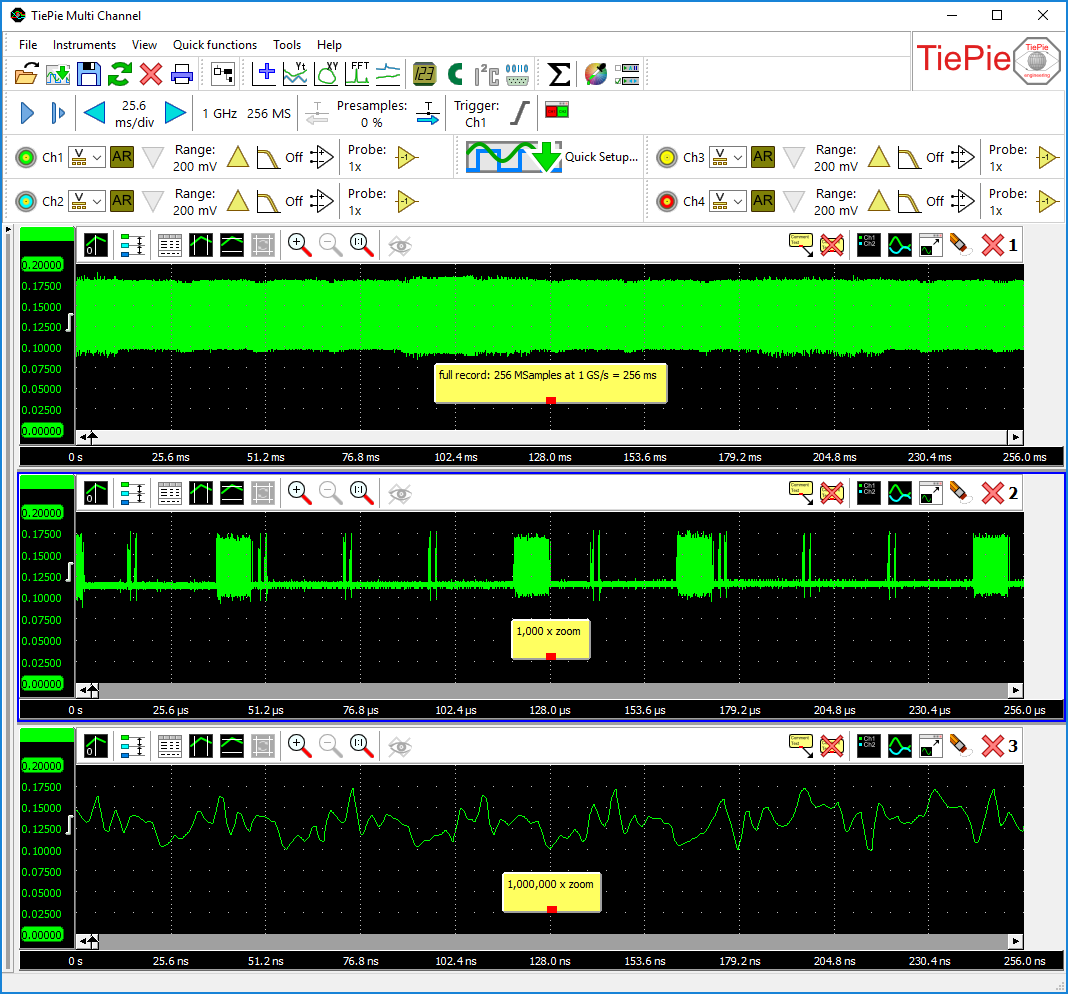
When measuring at high sample rates, a long record length is a must, otherwise the acquisition buffer is full before the signal is measured. Therefore, our Handyscopes can have up to 256 MSamples record length per channel.
To view all that data conveniently and yet being able to see all details of the signals, the Multi Channel oscilloscope software scope, spectrum analyzer and data logger support sophisticated signal drawing routines with unlimited zooming capabilities. The full signal can be shown on any display size, without loss of information. Yet, you can zoom in to any required level, to see the finest details in the signals. Zooming factors of 1 million of even more are no problem, you can zoom in far beyond sample level.
Analyze fast serial communication protocols
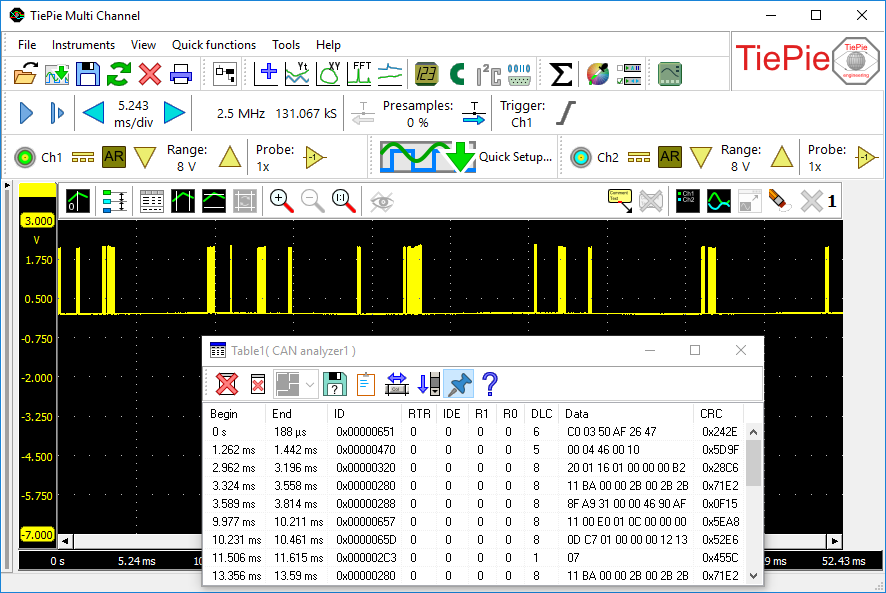
To analyze or debug your serial communications, simply measure the signal(s) transferring the protocol with your Handyscope and have them analyzed and decoded by one of the Multi Channel oscilloscope software protocol analyzers. The decoded information from the serial communications can be shown in tables, in graphs and in the multimeter.
A protocol analyzer is a useful tool when developing a hardware and/or software implementation of a communication bus. It can also be used when debugging device or bus failures.
24/7 Data logging
Measuring long term signal changes with your Handyscope is done with the Multi Channel oscilloscope software Data logger. The data logger logs your signal, continuously uninterrupted at high speed, 24 hour a day, 7 days a week. Results are immediately shown on the screen and all data can be stored to disk. A convenient toolbar lets you navigate through the stored files to find the important moments in the measurement.
